I’ve gotten to the point where spinning up an EC2 instance feels pretty comfortable, and it’s pretty easy to scale out to include additional instances as needed. Amidst that robust ability to create more and more, however, it’s important to be able to look at the performance of each instance – because these are finite resources and this does affect costs and user experience. I’ll be touching upon that using logging tools, as well as creating a CloudWatch alarm that is initiated upon a certain CPU threshold. This is good stuff to know! The SNS notification service will be used to let us know when that happens.
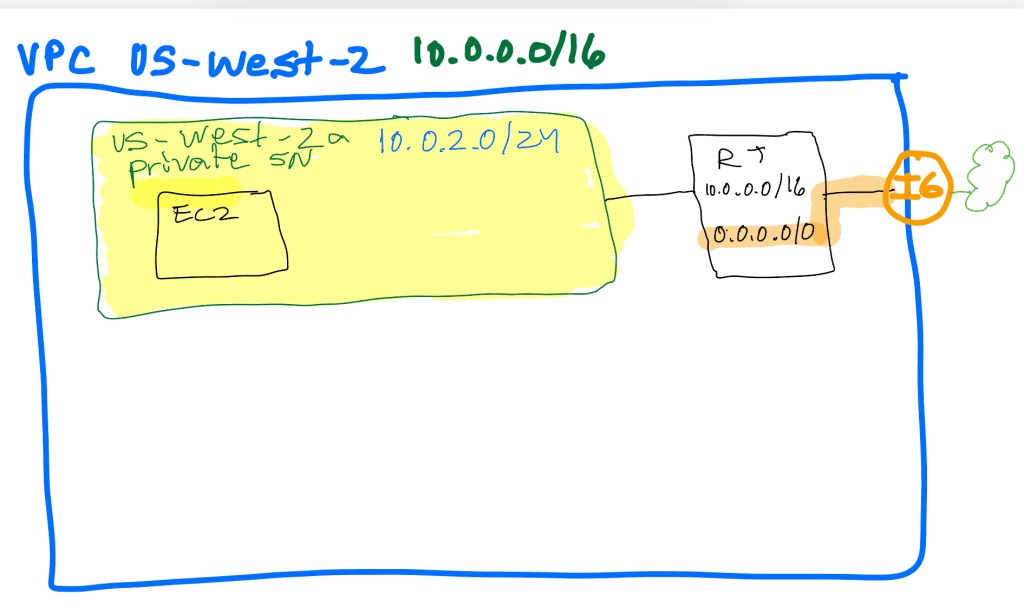
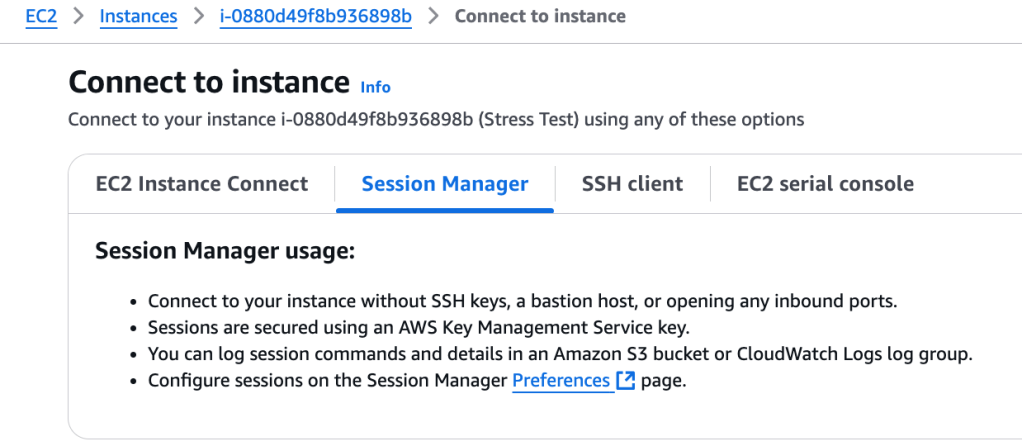
The EC2 Instance has an attached IAM Role: AmazonSSMManagedInstanceCore role, which allows Session Manager usage (so we can Connect without the use of SSH keys- convenient and secure).
First, we create an SNS topic and subscribe to it with an email address. This is exactly the process first done when a CloudWatch spending/billing alarm was created to make sure budgets were being adhered to.
Amazon SNS service > Create Topic (select Standard and enter a name)
Create Subscription > Protocol (I selected Email ) > Endpoing (I entered a valid email address where I could receive SNS alerts) > Create Subscription
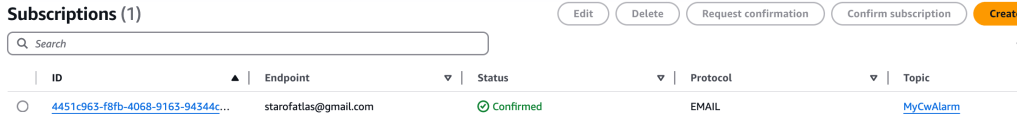
An email was sent to my email address, and I confirmed my wish for a subscription. Back in Amazon SNS, under Subscriptions, I can see that the subscription is confirmed:
Create CloudWatch Alarm
The goal is to create a stress test on the EC2 instance CPU, and if a threshold is reach, a SNS alert is sent.
AWS Services > CloudWatch > Metrics > All metrics > EC2 > Per-Instance Metrics
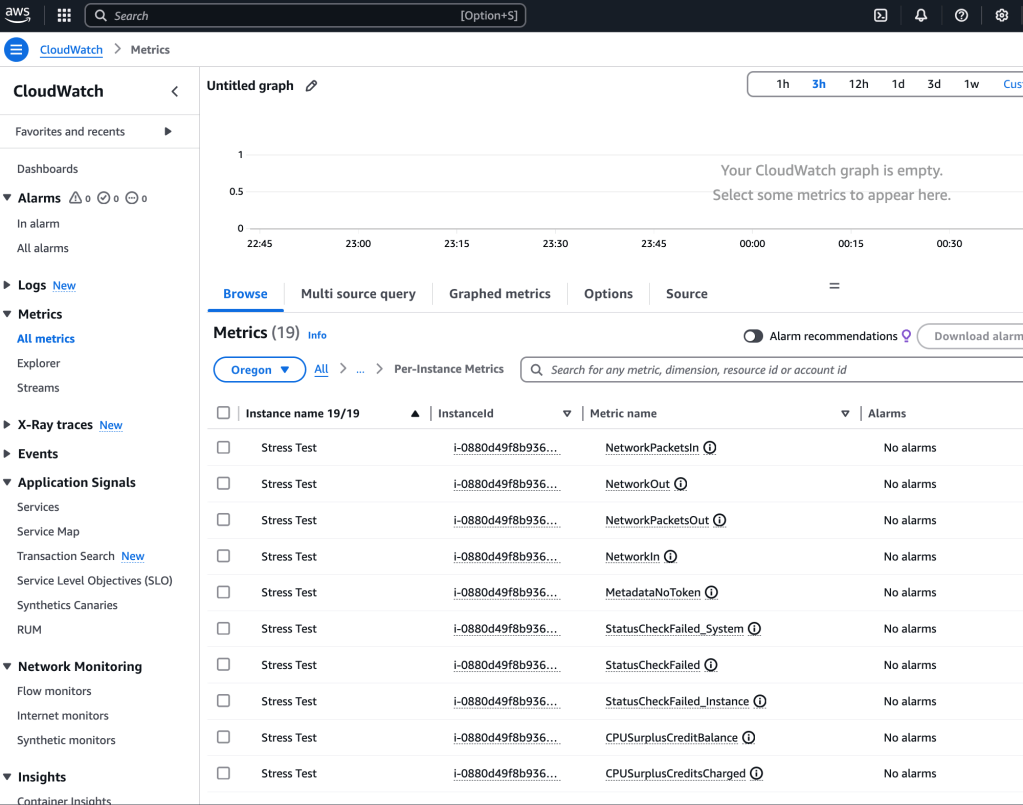
I select the CPUUtilization as metric name for the Stress Test name, then I set up config:
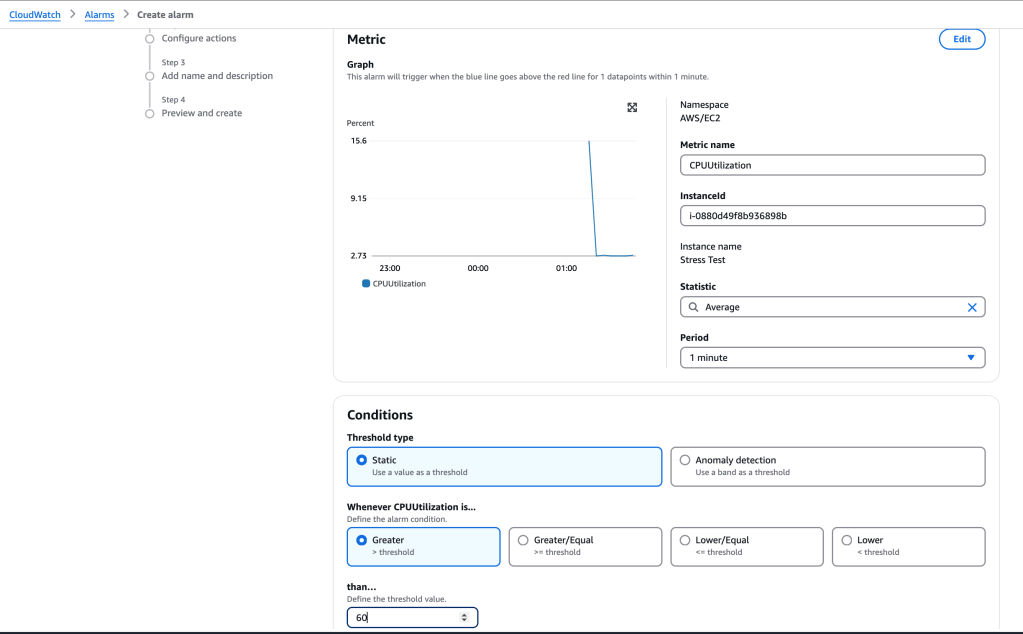
I select ‘Next’ and continue to configure:
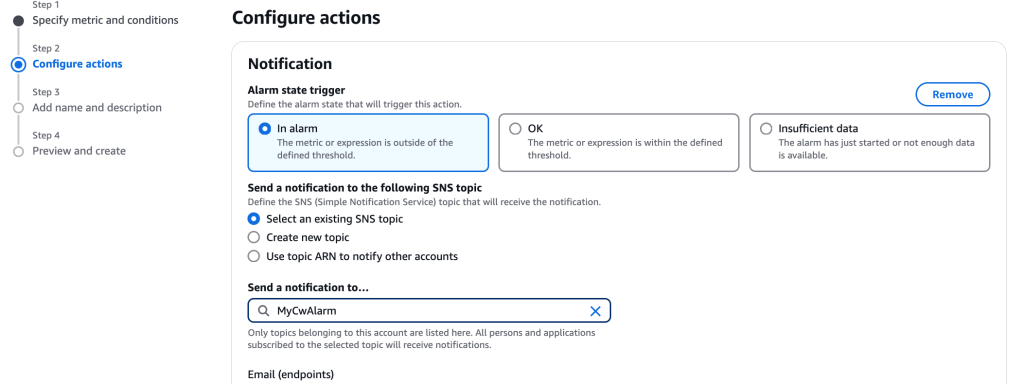
I give a name to the alarm, then ‘Next’
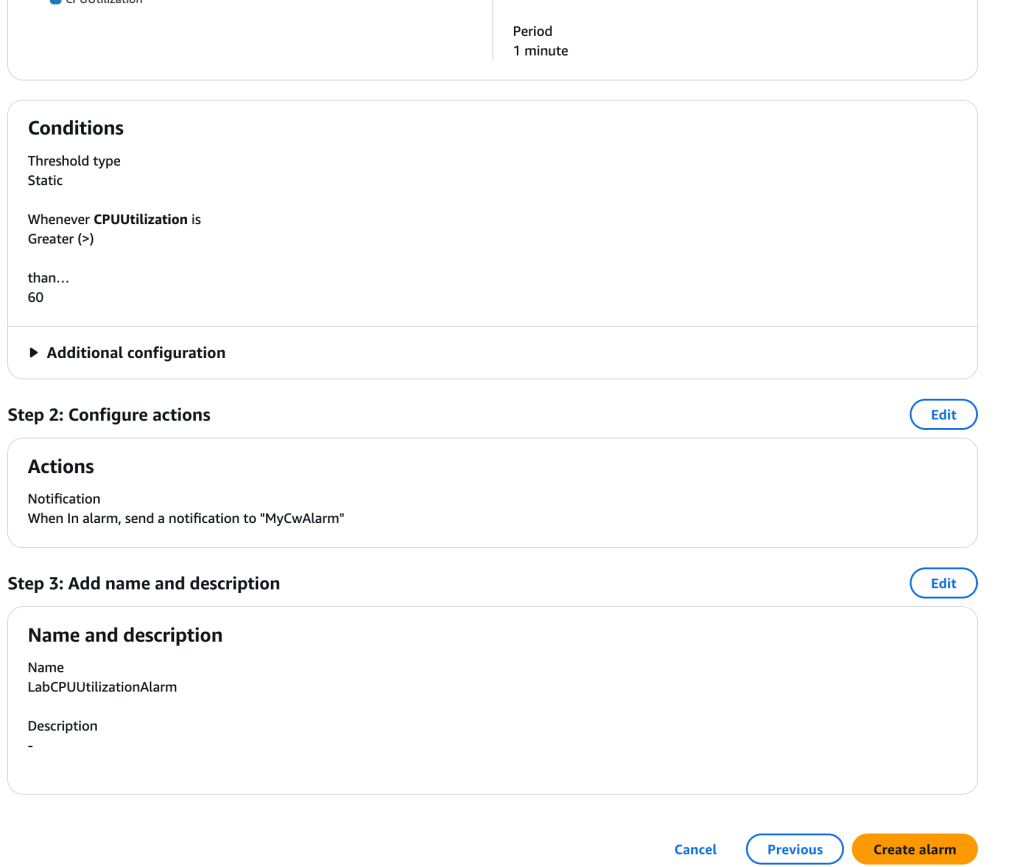
We arrrive at the Summary Preview page – it looks good, so I select ‘Create alarm’
Test the CloudWatch Alarm
Now it’s time to test the alarm that was created. I log into the EC2 instance via Connect:
In the CLI, I enter a command: sudo stress –cpu 10 -v –timeout 400s

This command runs for 400 seconds, loads the CPU to 100%, and then decreases the CPU back to zero again.
I open up a second terminal and use the $ top command to show the running processes of the Linux instance:
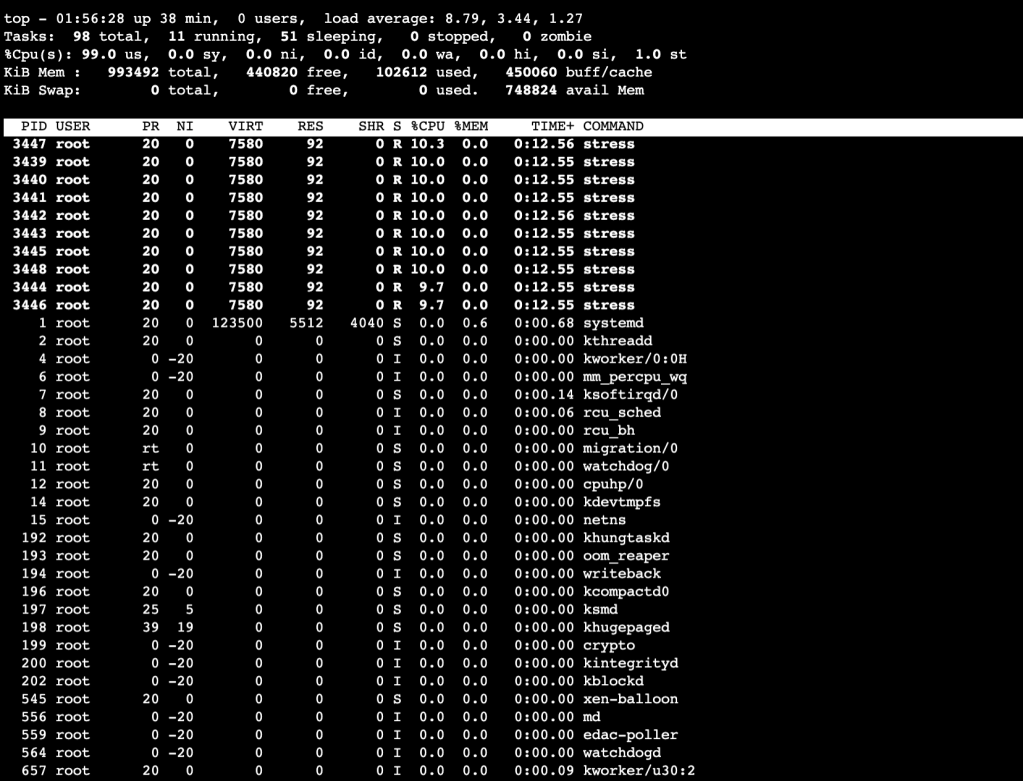
We can see that the stress test is putting the CPU to its paces!
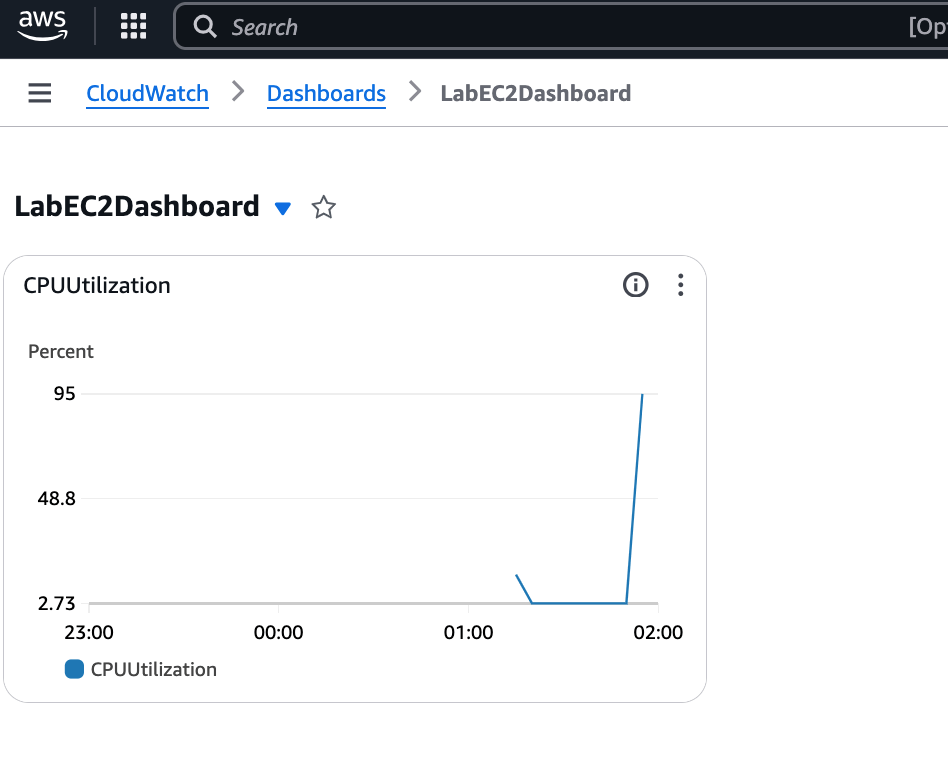
Back in CloudWatch landing page, I am able to access the graph of CPUUtilization, which shows a distinct uptick in CPU usage:
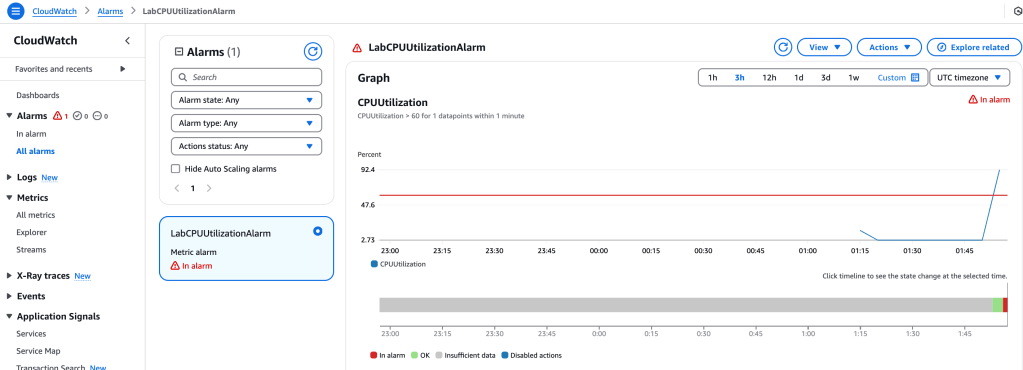
Sure enough, I received an alert email sharing about the EC2 state.
Create a CloudWatch dashboard
This is a handy feature as it’s possible to configure the dashboard to monitor all your resources, even in different Regions, in a single view.
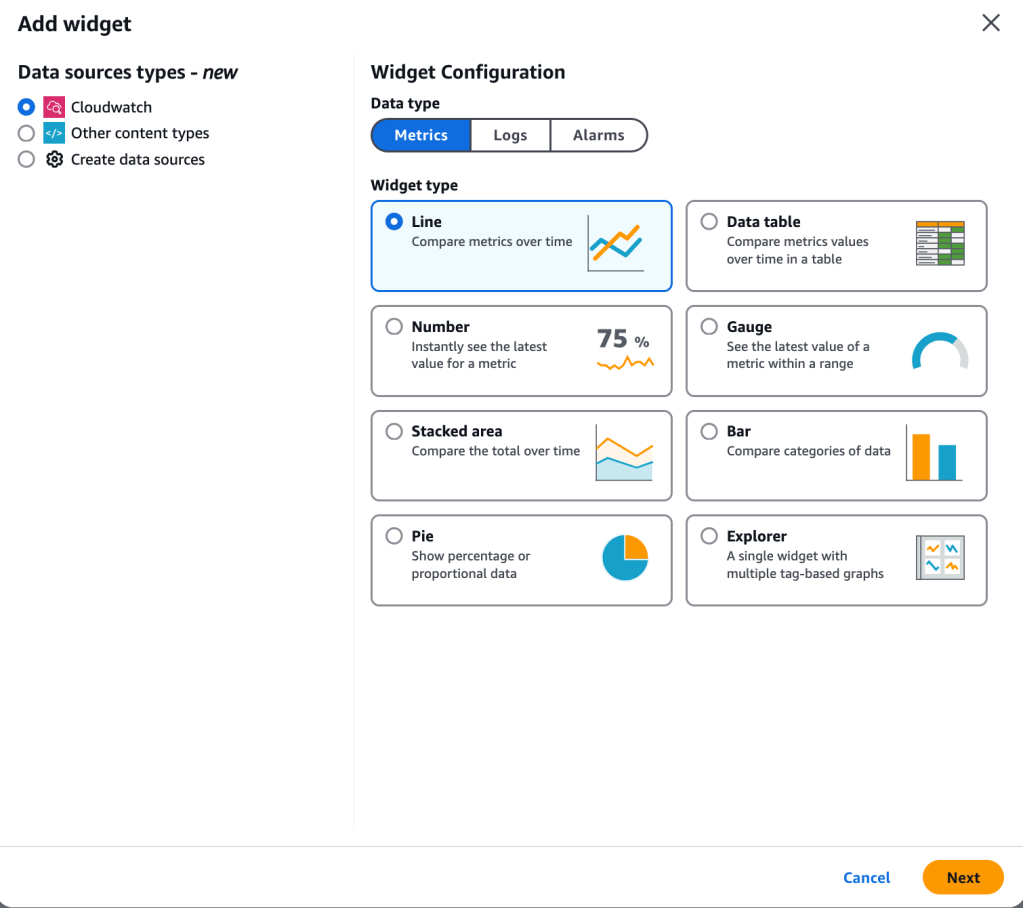
CloudWatch > Dashboards > Create dashboard
Now, let’s configure it. I selected Line for Data Type Metrics
I select ‘Next’ and then ‘EC2’ and then ‘Per-Instance Metrics’ and select the Stress Test created earlier, then ‘Create widget’
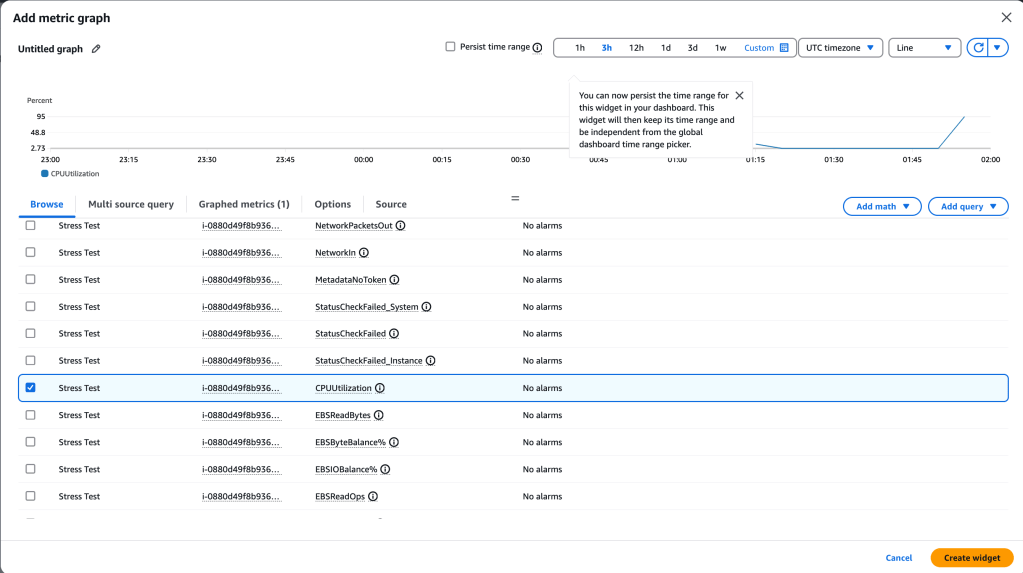
and Voila!