
CloudTrail is useful in logging API events, such as creating a VPC or instance, and also non-API events (such as logging in using the AWS Management Console), both management and data events. By default, management events are captured for 90 days, but if you want to capture data events (like s3 bucket or lambda), or if you want to capture management events for longer than 90 days, then you need to create a trail.
One of the benefits on CloudTrail is that it works well with CloudWatch- another AWS service which acts as a hub for a variety of inputs: EC2, EBS, S3, dynamoDB. A feature of CloudWatch is CloudWatch Logs, which collects logs from both AWS and non-AWS sources, then allowing you to query and analyze those logs (much more easily than if it was only a CloudTrail log). These logs can include: DNS, EC2, and CloudTrail logs. You can capture what is going on under-the-hood of EC2 instances by installing CloudWach Agent – this will allow you to capture memory utilization, for example, which otherwise you wouldn’t be able to do (you can get CPU utilization without installing the Agent, but for other metrics, you need to install the Agent).
In any case, by creating a CloudTrail log and storing that data in an S3 bucket, you then have the ability to analyze that data using a variety of methods: Linux commands (grep comes to mind), Python scripts, or such services as AWS Athena. Let’s explore those…
I have an EC2 instance, which has a security group (SG) configured for port 80 HTTP access – I edit the rules to allow port 22 SSH access from my particular IP Address
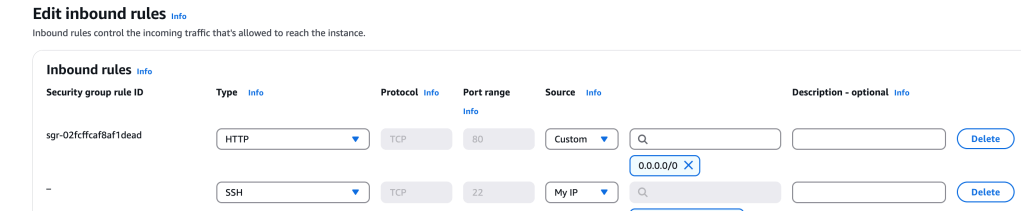
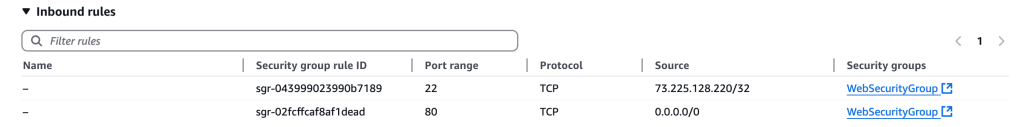
This is now updated to port 22 and port 80:
I am able to access the web server’s web page by entering its Public IPv4 address, copied from the Console.
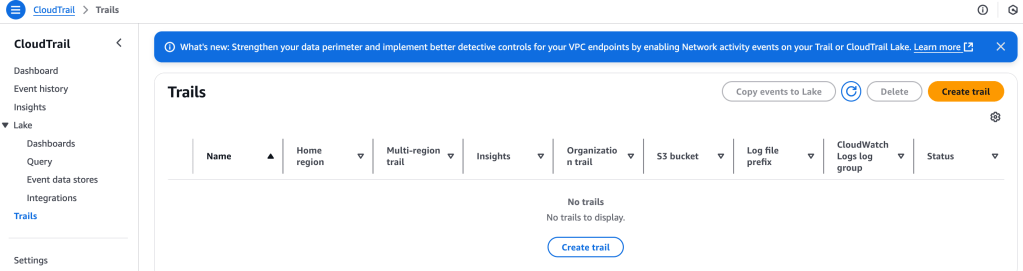
Create CloudTrail Log
I head over to Management & Governance > CloudTrail > Trails > Create trail
I add some config values, including creating an S3 bucket, making sure the data is encrypted
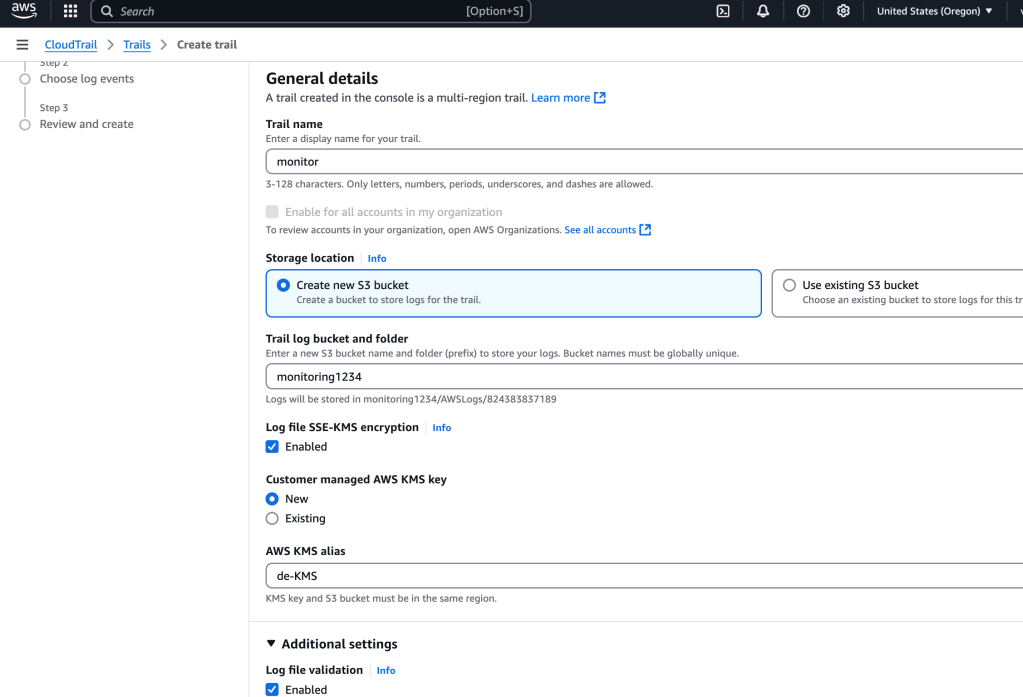
I didn’t select it, but there’s an option to configure CloudWatch logs here:
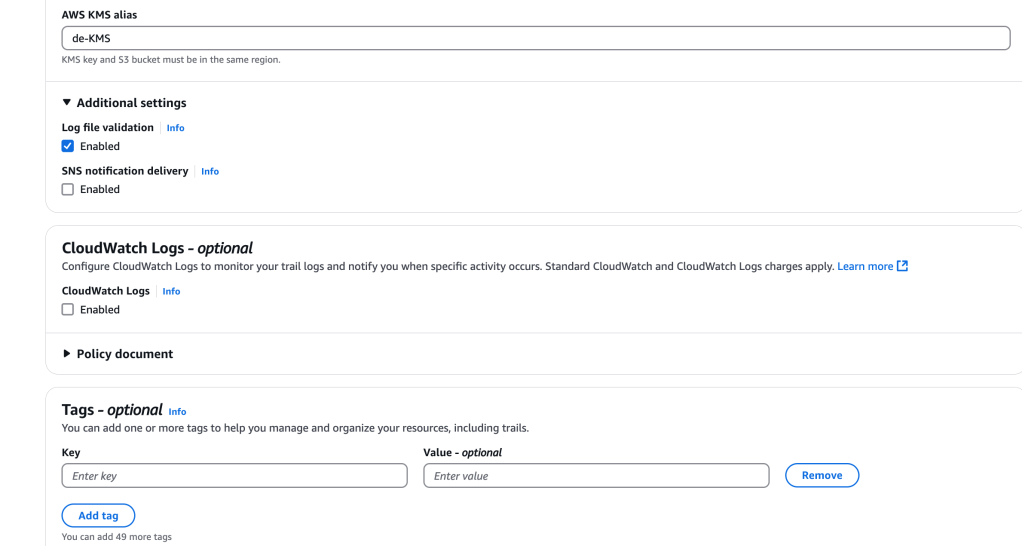
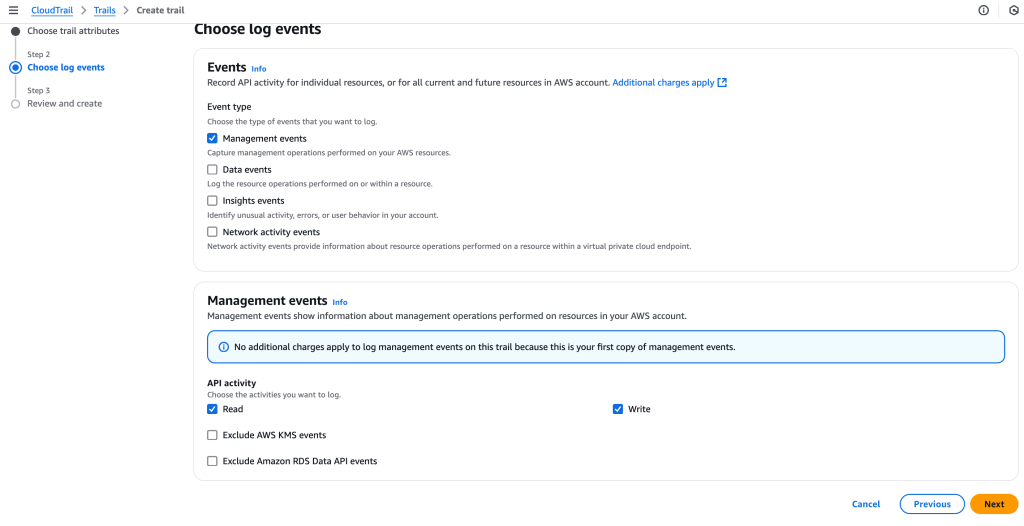
Next up, I can select log events: management events, data events, Insights events (abnormal behaviors), Network activity events(within VPC)
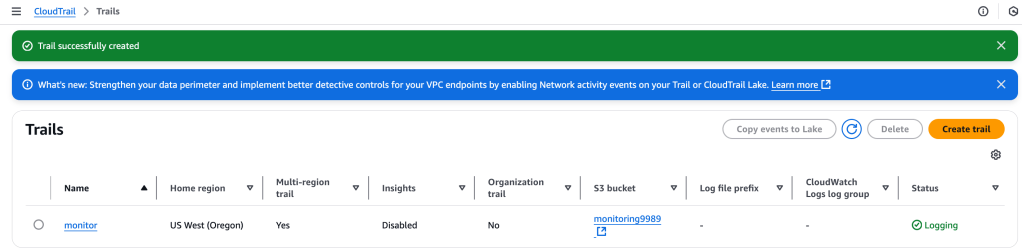
And then the trail is created:
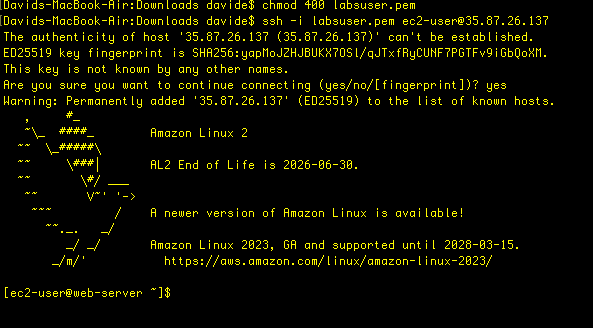
I want to verify that the CloudTrail is working, so I SSH into my instance:
I’m going to access the s3 bucket that I created during the CloudTrail config, and then copy those files into the local EC2 instance file directory.

aws s3 cp s3://monitoring9989 . --recursive # copy files recursively from s3 bucket to this folder
A zipped file has been provided, so I navigate through the file hierarchy until I find the folder for today, then unzip it:
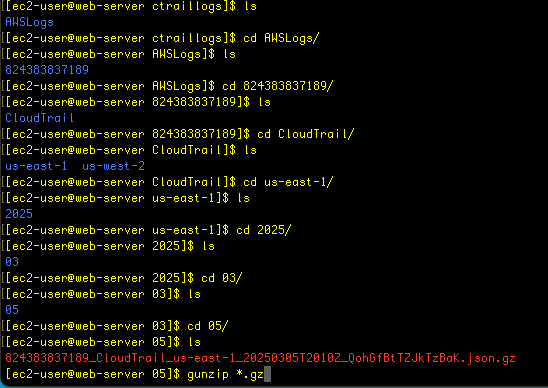
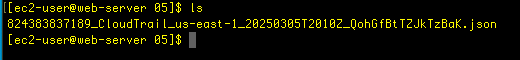
It’s a JSON file, which I will now analyze using Linux grep utility – the screenshot below is without using any tools, so it’s hard to read:
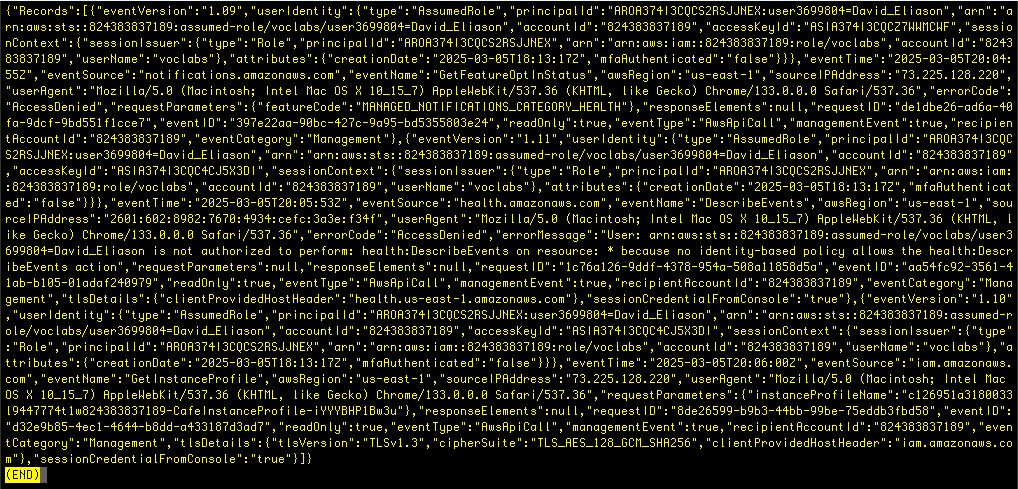
# json.tool to make output easier to read
cat <really_long_filename>.json | python -m json.tool
I want to filter the results, so I set a variable for the EC2 instance IP address:
ip=35.87.26.137
Now, with that I use this Python script that uses a for loop to echo the file name and the contents of the file- but only the ones matching the ip address variable:
for i in $(ls); do echo $i && cat $i | python -m json.tool | grep sourceIPAddress ; done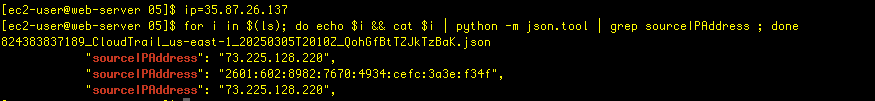
Another approach is to use AWS CLI CloudTrail command – see this reference.
I select the lookup-events command in the updated version of docs, and get the following description with an example:
aws cloudtrail lookup-events --lookup-attributes AttributeKey=EventName,AttributeValue=ConsoleLoginI don’t get any results when I run this command in the console:

So there were no console login events. But there are other possible ways to access the server..
I select a different command that finds the security group ID that is used by my ec2 instance:
region=$(curl http://169.254.169.254/latest/dynamic/instance-identity/document|grep region | cut -d '"' -f4)
sgId=$(aws ec2 describe-instances --filters "Name=tag:Name,Values='Cafe Web Server'" --query 'Reservations[*].Instances[*].SecurityGroups[*].[GroupId]' --region $region --output text)
echo $sgId
This returns a SG ID, which I use for the next command:
aws cloudtrail lookup-events --lookup-attributes AttributeKey=ResourceType,AttributeValue=AWS::EC2::SecurityGroup --region $region --output text | grep $sgId
This provides a variety of outputs, but this does show how hard it is when working with large datasets. CloudTrail logs are very verbose and detailed, which is both good and bad!
