I’m getting myself back up to speed with All Things AWS so, to get my feet wet so to speak, I spun up an EC2 instance and enabled detailed monitoring.
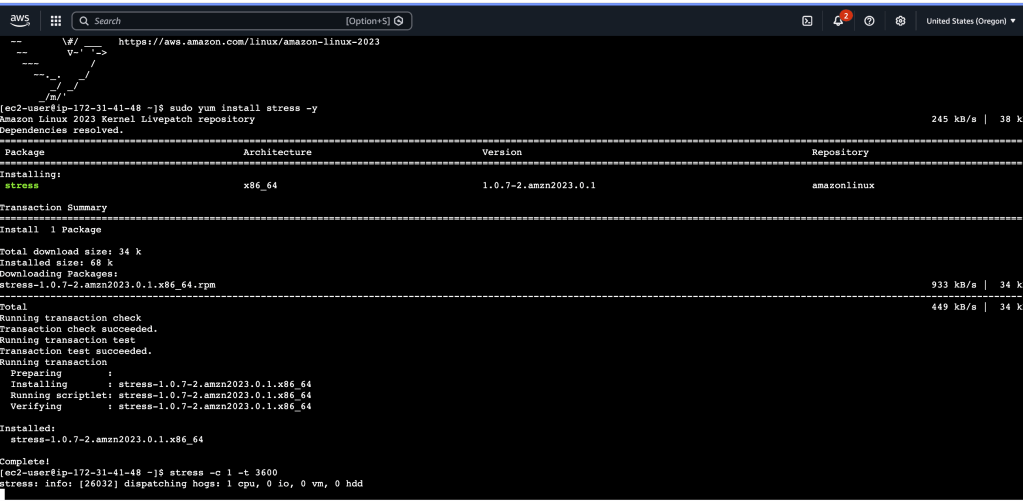
Once the instance was live, I EC2-Connect (no SSH required) and installed the stress module. This allows some artificial stress constraints to be put on the instance CPUs. I ran that for a while, then went to the CloudWatch dashboard.
I clicked on the CPUUtilization metric that was available for the particular instance, and was able to see the alarm status being invoked as a result of an alarm I had created (over 15%).
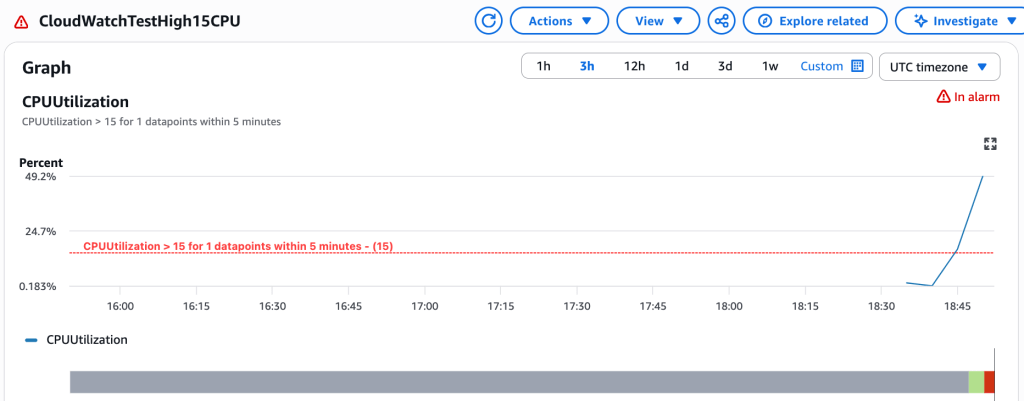
This alarm wasn’t connected to an Event or anything, just POC, but still helpful to see in action
